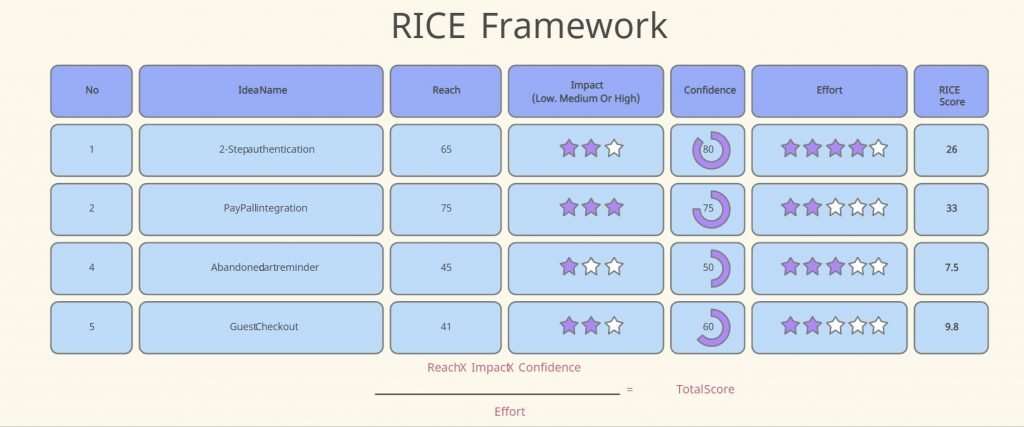
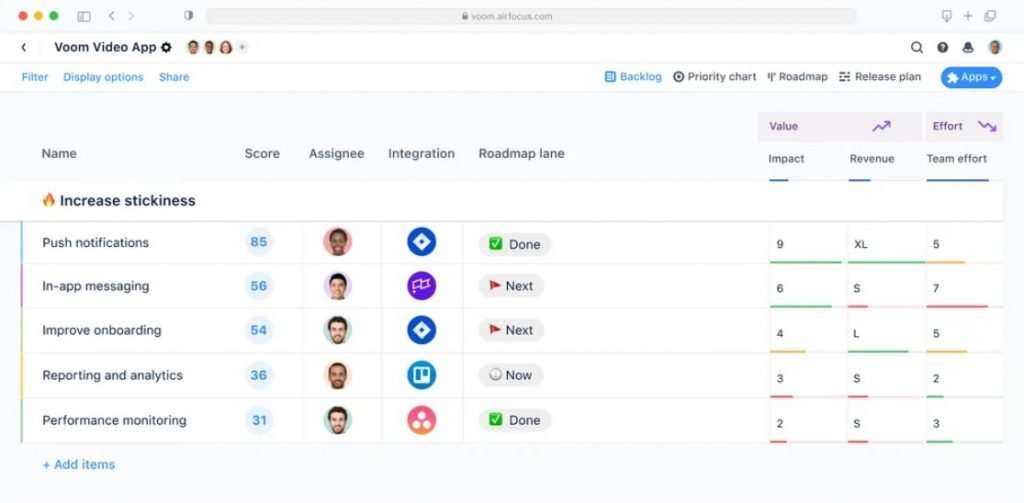
The RICE framework is one of many prioritization frameworks that is structured to allow for managers to make a determination of which features and products to prioritize in development and to place on their product roadmaps.
The prioritization process of theses features are determined through the scoring of four factors that form the acronym for the
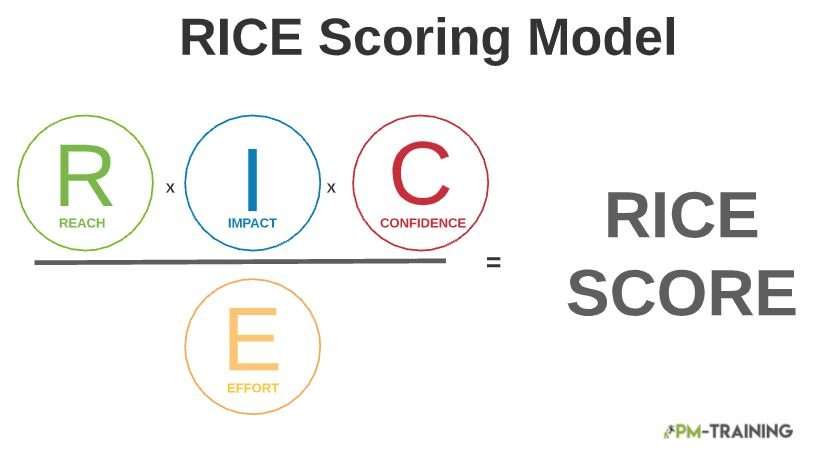
RICE Method: Reach, Impact, Confidence and Effort.
This system is beneficial for preventing product managers from implementing bias when it comes to selecting features or products to release avoid bias towards features and projects you personally prefer. It is designed to benefit your product teams by creating balance in selection.
Reach
The first factor in determining your RICE score is to get a sense of how many people you estimate your initiative will reach in a given timeframe. An example of calculating reach would be to tracking website users per month on an About page.
If there are 1000 total website users and 300 users visit the About page, the reach would be calculated to being 30% of all visitors over the time frame of a month. You could then calculate for what to expect in terms of viewership in a quarter.
It is important to use realistic measurements instead of thinking of random numbers on a whim. This is best for insuring accuracy in data.
Impact
Impact is related to how a thought will affect a specific goal for an individual customer.
The important question to ask when making a determination of the impact of a feature would be if it would improve conversion rates or improve ease of use.
Another question to ask is “Would there be a massive impact on conversion or user experience if a feature was not there”? When it comes to making a website, you may measure the benefits of having an inquiry form on the website or ensuring that the website is developed to be ADA compliant.
Traditional ways of measuring the impact score would be a multiple choice scale with 3 being a massive impact and .25 being a minimal impact.
Confidence
The confidence component allows for you to measure how confident you are in the estimates for the reach and impact scores that were made regarding a specific feature. Asking yourself the question of how confident you are in the score for each feature could range from 100% to 0%.
If your team has a quantitative metric for reach, and thorough user research for impact, you would most likely score your teams confidence for that feature at 100%.
If your team is unsure about the impact, but relatively sure about the reach, then you would give the feature a score of 80%.
Scoring a feature with the medium confidence of 50% would be attributed to having a lower than estimated reach and impact score with the likelihood of an increase in effort. Establishing a confidence score as a component of your RICE score will allow for you and your team to have more control in projects. This will make a determination for what features has the data to support it and what features are being reliant on intuition.
Effort
While potential benefits are calculated through the Reach, Impact, and Confidence, effort is the portion of the RICE scoring model that more closely represents the cost of a feature.
When making the estimation for actual effort, you would measure by “person-months” which is defined as the approximate amount of work that one person on the team can accomplish within a month.
While there are positive factors in this, the more effort a feature requires, the worse it becomes. So it essentially divides itself from the total impact.
Calculating effort would be in a similar way as you would score for reach. The total number of resources that are needed to complete a task in a particular amount of time would be the score that you would assign it.
If integrating Google calendar into a website for booking purposes takes a week of planning, three weeks to develop, and 1-2 weeks of design, it would essentially be given an effort score of a 5 Person-Month.
After these numbers from Reach, Impact, Confidence and Effort are calculated, you will then have your total RICE score for that particular feature within your website.
How Do You calculate RICE Framework Formula?
Firstly, you determine the score of each factor of RICE:
- Reach: How many people are going to be impacted by this feature within this time period?
- Impact: How much will this feature impact each person?
- Confidence: How confident are we in the estimates that we’ve made about Reach and Impact?
- Effort: How many “person-months” will this take to complete this feature?
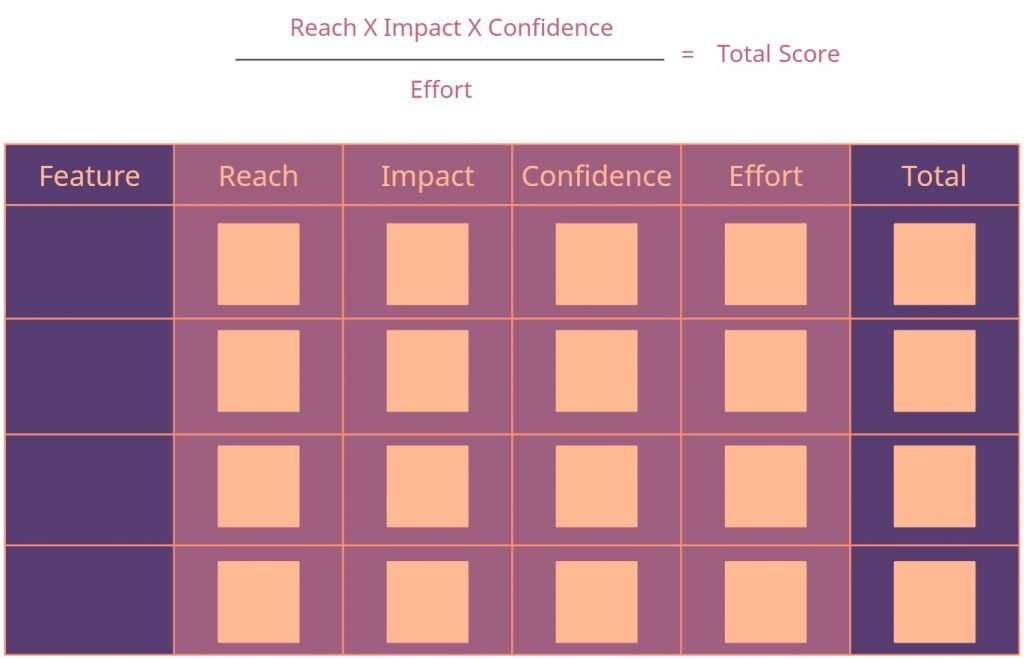
Secondly, you can use a RICE framework template (if you have multiple features) or else you just simply:
- Multiple Reach by Impact by Confidence
- Divide the total by Effort
- The total is your RICE score
- Rinse repeat for all features / projects / initiatives
If taking a look at your scores and you believe that one may be too high or too low, it would be a good decision to reconsider them and recalculate them by changing confidence to weight it appropriately.
Once you feel confident in all of your scores, you should be able to know which project should be prioritized first and your team will be able to begin working on its completion. The features that received lower scores would likely be a place of focus in future projects.
Rice Framework Pros and Cons
Evaluating the pros and cons of using the RICE method is best to be analyzed through the lens of cost vs benefits.
Pros of RICE Framework:
- Product Teams are allowed to make a determination on how much their effort is worth in comparison to the overall value of a particular feature. As a product manager you want to maximize getting the most out of the effort that you make.
- Your team has the ability to develop a comprehensive visual of the impact a product or feature has and how it aligns with the teams vision and overall initiatives.
- It is also useful for limited team biases in decision making.
Cons of RICE Framework:
- Tendency for inaccurate scoring: evaluating the reach of the future impact of a project can present itself as difficult.
- Dependencies sometimes aren’t considered: There are scenarios where a product that is scored low should have priority over one that is scored higher.
- Bias still have tendencies to occur: Some team members may prefer one particular concept than another and it would be important as a product manager to assess to provide an unbiased opinion.
RICE Framework Alternatives
The RICE Prioritization method is just one of many prioritization methods that product managers can implement when it comes to product development. Two of the most common alternatives are the Kano and MoSCoW methods.
RICE Framework vs ICE Framework
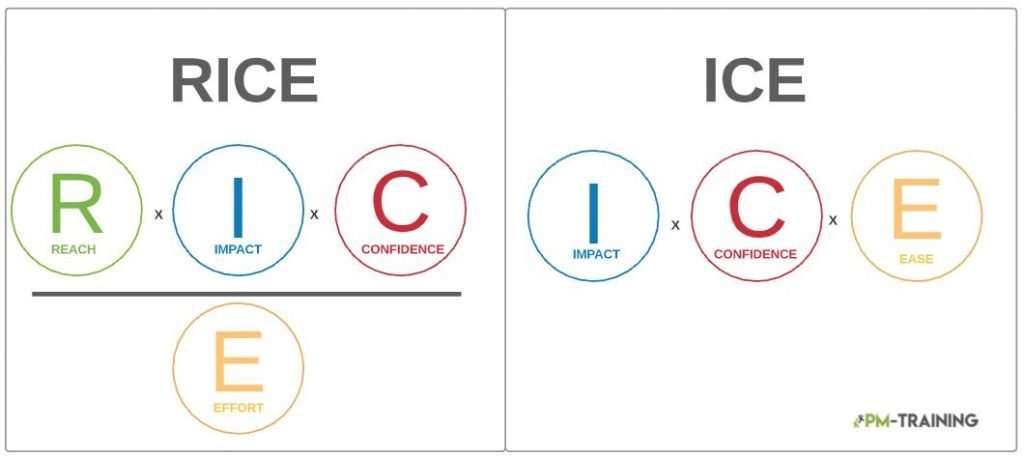
RICE has gained significant traction to be utilized over the ICE score model. As a backlog prioritization framework, ICE is ideal for determining the most valuable products as well as what the most profitable task would be for your team. It was created by Shawn Ellis and designed to prioritize experiments related to growth. ICE, which stands for Impact, Confidence, and Ease is measured on a ten point scale.
Like RICE, the higher the score, the more profitable the task may be for your team. One of the primary differences between measuring ICE is that Reach and Impact typically are merged together.
Whereas RICE would separate them for further analysis. ICE is simpler to use in comparison to RICE because of this determining distinction that doesn’t require access to how the product is used or data that communicates customer behavior. RICE finds most of its benefit by further analysis of customer behavior so that they can best prioritize the most profitable product.
Kano Model Analysis
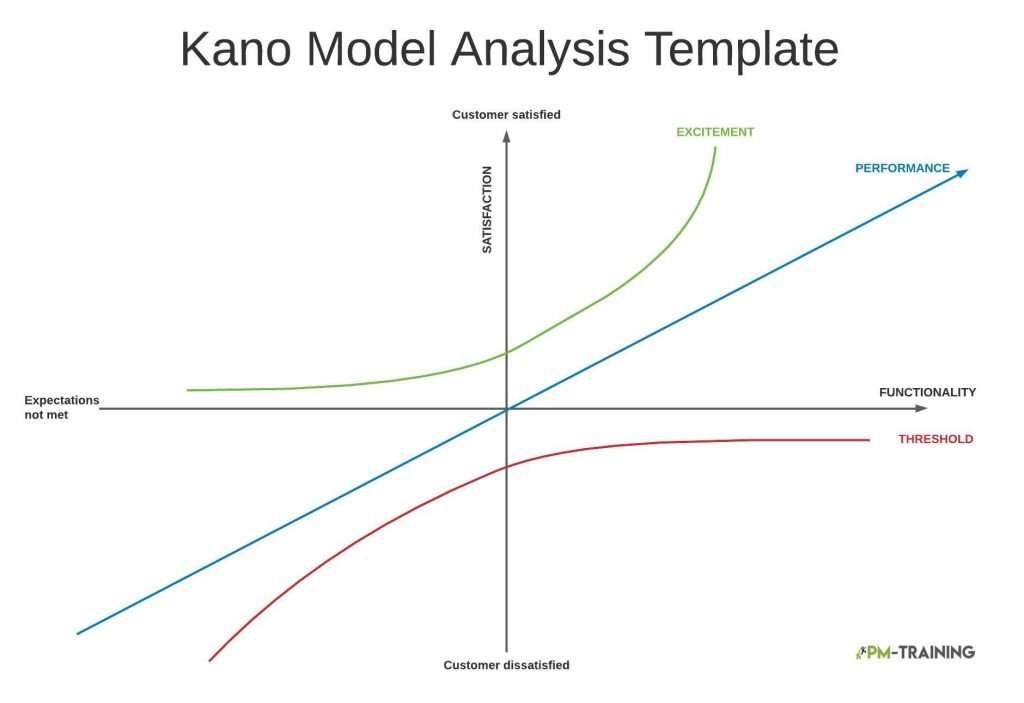
The Kano Model Analysis, was created by Dr Noriaki Kano, a Japanese researcher and professor at Tokyo University of Science. The Kano Model gives three attributes to products and services which are:
- Threshold
- Performance
- Excitement
The threshold attribute, also known as basic attributes, are the absolute minimum requirement that a customer would expect a service or product to have. These are typically functional aspects of a product.
The performance attribute are features that aren’t essential to a product, but they contribute to the way that a customer will enjoy a product or service.
The excitement attribute are surprising features that will allow for the product or service to have a competitive standing within the industry. It is something that a customer may not have any expectations for it or know that it is something that they enjoy having it. Seeing the feature gives a lasting impression of excitement. You would be able to assess this in user feedback.
The Kano Model factors both customer satisfaction and product function when implemented and it contributes to overall product value.
MoSCoW Method
The MoSCoW Method is also known as the MoSCoW Prioritization Technique or MoSCoW Analysis. Created by Dai Clegg of Oracle UK consulting, this method is most frequently used in Agile Product Management to make a determination for what is or isn’t important in product development. This method is also useful in creating a bridge of communication for stakeholders so that they are able to see what your product management team is working on and why they are working on it.
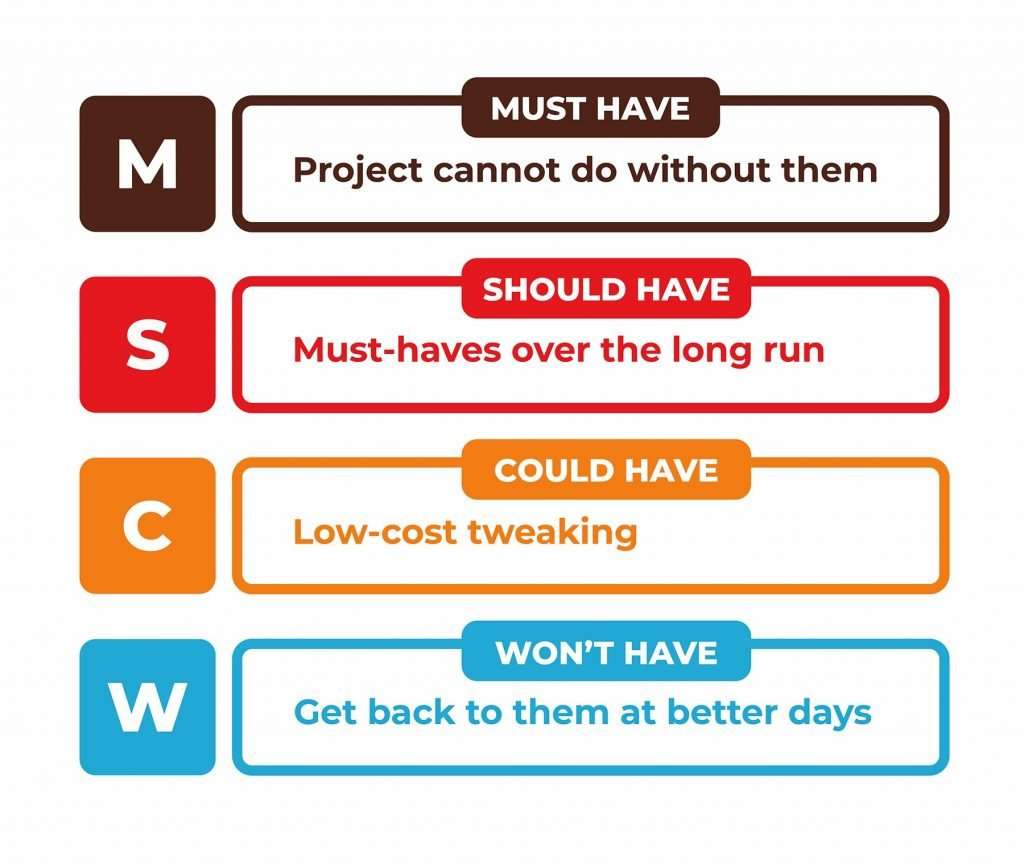
MoSCoW is formed to represent the categories: Must have, Should have, Could have, and Won’t have.
The Must Have category represents features that a product absolutely cannot do without.
Should Have are things that are high priority and should be included in production, but the product can do without them.
Could Have are features in a product that aren’t necessary to the value of a product if not present, but does contribute to the increase of the product value when added.
Won’t Have are features that a product may not have in the 1st project of development. It doesn’t mean that it will never be included nor considered in future projects. Sometimes Won’t Have features may be something that the project management team may include in the 2nd project.
>> More info about Product Owners Perspective on MoSCoW Prioritization in Agile
Tools for RICE Prioritization
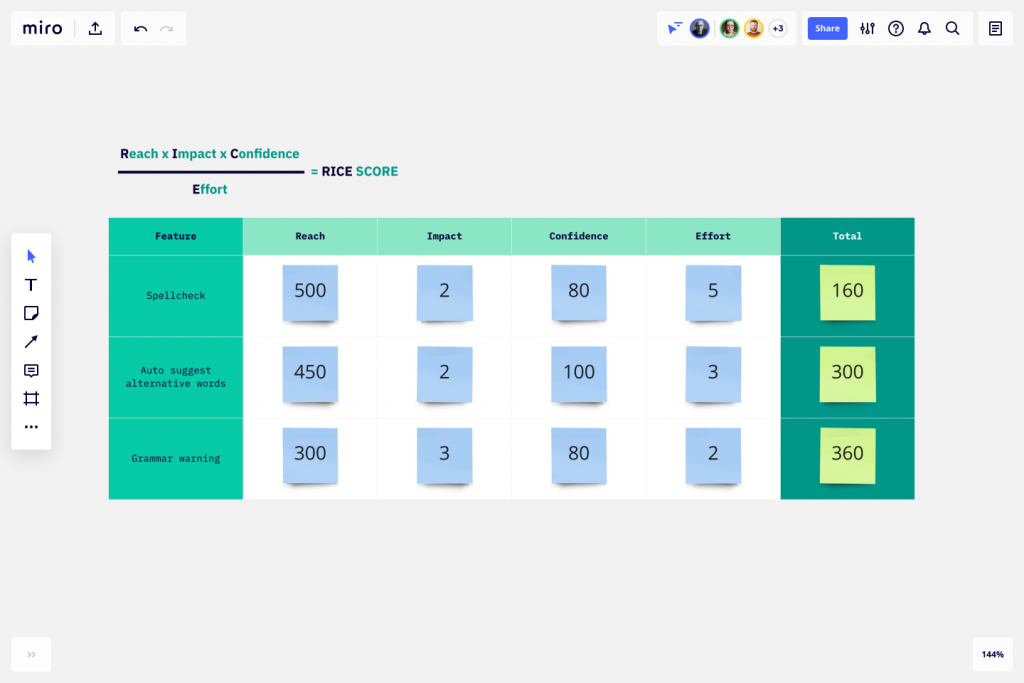
Miro
You need to manually calculate the scores in Miro which is a pain. That is why we use a copy of our google sheets RICE framework template.
AirFocus
Creately
