Agile project metrics for leadership team are just as important as they are to agile project managers. The agile project metrics senior executives should be interested in are all related to predictable delivery of the agile team. To track the development process at a high level senior stakeholders are generally only interested in key performance indicators.
At a minimum they should want to review team velocity over a period of time and review WIP to ensure the team aren’t being distracted from working on what’s important. There are different levels of data available on agile projects depending on how much detail you need. All the different stakeholders can use their own unique set of agile metrics in agile projects.
They primarily provide a way to monitor and provide status reports on the agile project team to stakeholders but also can help the team improve their performance. They are essential way of tracking the software development process outputs.
If new to agile metrics they also need to famialrize themselves with burndown charts, control charts and scrum or other agile development process. They firstly need to know the cycle time before they can read any data.
Cycle Time
Cycle time is the total time working on an issue, from once the work begins to when it ends. This includes time if an issue is reopened, worked on and completed again.
Sprint or scrum cycle time is the duration of the sprint. This leads onto the expected team velocity.
>> More info on Cycle time by Full Stack Agile
Agile Team Velocity
There is no waterfall equivalent to velocity as the team doesn’t work in iterations. The velocity is determined by gathering data during development and analyzing it to determine the expected throughout of the team per iteration. The velocity is the average amount of work completed in an iteration measured in story points. The goal is to have consistent cycle times for a product team.
The sprint velocity will vary at the start while the software development team is getting used to estimating but after a few iterations should start steadying and act as a baseline. Once this baseline has been set the team will be aware of how much work they should commit to in each iteration based on their expected velocity.
This will result in the team being more productive and delivering exactly what was planned. If a velocity chart starts being erratic it merits an investigation into the estimation and commitment process to determine if the team are over committing, estimating, is there too much pressure on the team etc.
>> More Info on How to Measure Velocity by VersionOne
Sprint Burndown Chart
Burn rate is the budget equivalent to velocity. Burn rate tracks work completed to man days. This enables you to track cost as the velocity tracks scope. Burn rate is also the basis for the burndown chart which is explained in the next chart but is a key chart to tracking the iterations progress.
Burndowns charts are primary considered scrum metrics and would be considered essential metrics for tracking the software development teams progress.
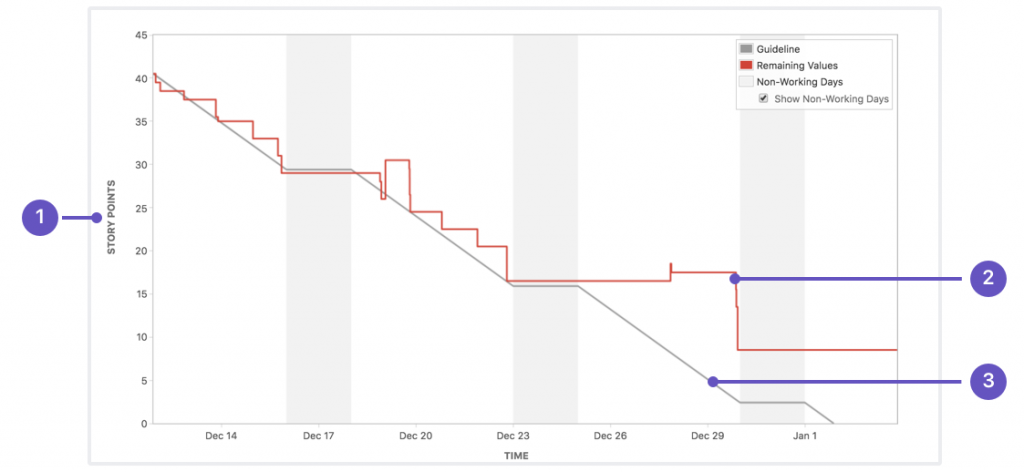
1. Estimation Statistics
2. Remaining Values
3. Guideline
The scrum burn-down demonstrates work remaining, the scrum burn-up demonstrates work completed. As the scrum burn-down chart is used to demonstrate the remaining work for a given period of time (time frame), it helps provide a quick update if the project is on track to hit its target. You can have a burndown chart for sprints and releases.
>> Really good article on Anti-patterns of Sprint Burndown Charts
Sprint BurnUp Charts
The sprint burn-up chart shows how work has been completed and the total amount of work. One key difference between both charts is that the burn-up visibly demonstrates added/removed scope better than burn down charts.
>> More info on Burn Up Charts
Work In Progress (WIP)
Any software that has been started but no completed. This also includes stories that have been developed but not deployed to production can be considered “work in progress”.
- WIP consumes investment as it delivers no ROI until turned into an actual released product. It represents money spent with no return which needs to limit.
- WIP hides bottlenecks in processes that slow overall workflow.
- WIP represents a risk in potential unknown rework since there could still be changes for stories not yet accepted.
Work In Progress limits is used to limit the amount of stories allowed in each column on a Kanban board. WIP limits are a strategy for detecting preventing bottlenecks. The WIP limits are agreed by the team before a project starts and enforced by the team facilitator.
When a WIP limit has been hit for a certain task the team stops and works together to clear the bottleneck. John Little created Little’s Law a mathematical formula based on queueing theory that can be used to analyse work queues on Cumulative Flow Diagram. The formula proves that the duration of work queue is dependent on its size which is why WIP Limits are so important.
>> More info on setting WIP by the Agile Director
Using Control Charts in Agile Projects
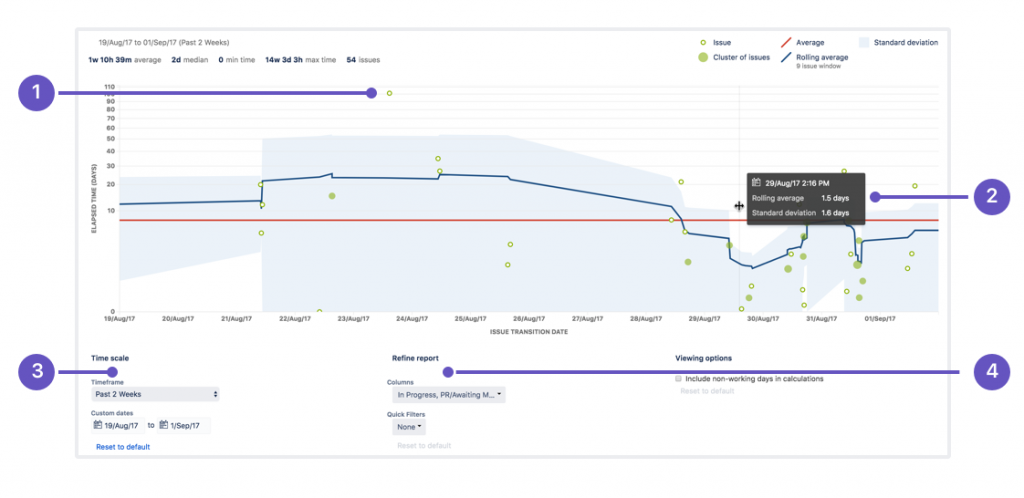
1. View issue details: Select a dot to see data for a specific issue.
2. Zoom in: Highlight an area of the chart to focus on a specific time period.
3. Change the timeframe Configure the time period you want data for.
4. Refine the report: Select the columns, filters, and swimlanes you want data for.
Quality Agile Project Metrics For QA Manager
Defect Detection Rate
Defect rate is a number of defects detected per iteration. In theory, the defect rate should correlate with the iterations velocity under the presumption developers will produce the same amount of defects at the same or less rate. The more story points delivered the more defects should be reported.
Defect Closure Rate
Defect closure rate is the amount of defects closed in an iteration. It should equal a number of defects detected per iteration if not the defects are not being prioritized with a sprint and will end up moving along with a project.
>> More info on Defect Metrics in Agile by iSixSigma
Unit Tests
Unit testing is a type of testing in which individual units or functions of software testing. Its primary purpose is to test each unit or function. A unit is the smallest testable part of an application. It mainly has one or a few inputs and produces a single output. It is the responsibility of the development teams to ensure this is complete by end of sprint.
Code Coverage or Code Reviews
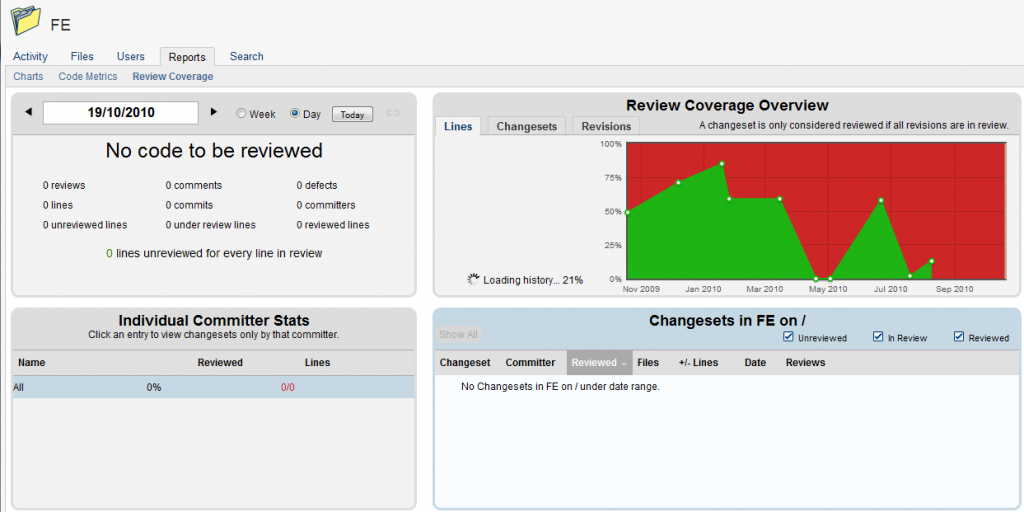
Code coverage is a software testing metric that determines the number of lines of code that is successfully validated under a test procedure, which in turn, helps in analyzing how comprehensively a software is verified. Developing enterprise-grade software products is the ultimate goal of any software company
What is Code Coverage and how to measure it? Code coverage benefits (codegrip.tech)
Variance Analysis of Production Environments
Variance analysis is used to identify the difference between expected and actual performance. Variance measures how far apart things are and how much they vary. Some variance is expected but it should be within acceptable limits, even highly engineered processes take into account some degree of normal variation due to normal fluctuation. Edward Deeming defined two types of variation:
- Common Causes: These are issues that are day-to-day differences to doing work.
- Special Causes: These are are issues that cause greater variance by a one-off or special cause.
Deeming determined it is a classic mistake where managers misinterpret common cause for a special cause and vice a verse.
>> More Info on Variance Analysis
Cumulative Flow Diagrams
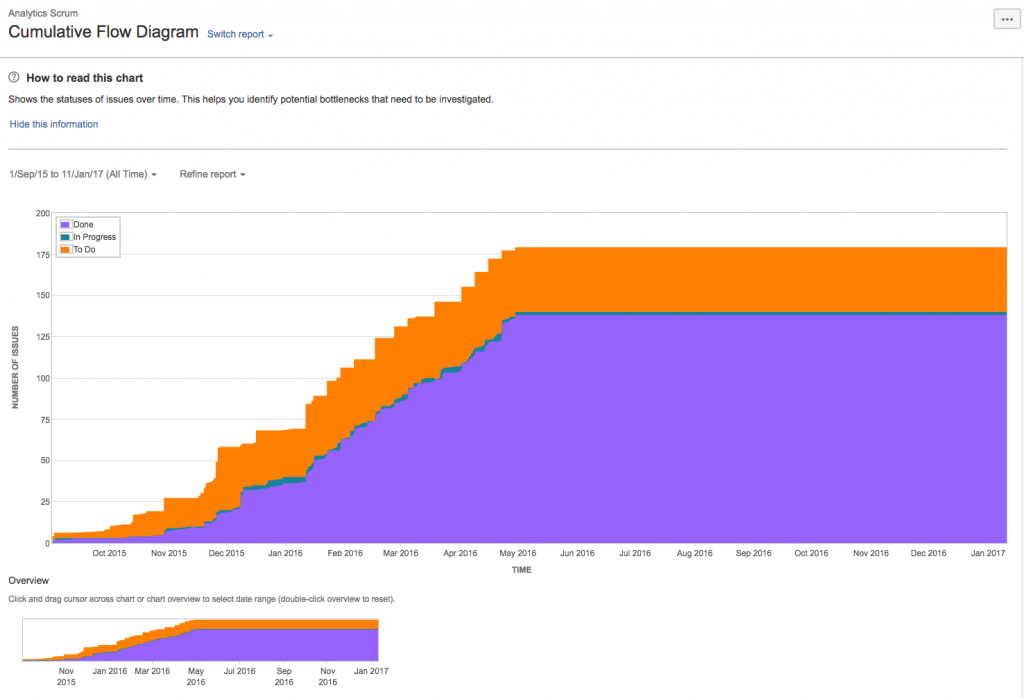
A Cumulative Flow Diagram (CFD) is an area chart that shows the various statuses of work items for a particular time interval. The horizontal x-axis in a CFD indicates time, and the vertical y-axis indicates cards (issues). Each coloured area of the chart equates to a workflow status.
EVM for Agile Project Management
Earned Value Management is a well known traditional project management schedule tracking technique to determine a project’s performance and help forecast future performance. It tracks scope, time and cost against planned performance.
Agile EVM is an adapted version of earned value management. Agile project management with EVM uses Scrum artifacts as inputs and then uses the traditional EVM formulas to provide traditional EVM metrics. Estimates can be in hours, story points, team days or any metric that is consistent in sizing stories as long as it is a numerical value.
To calculate you can start by gathering per story: Estimated User Stories Point, Completed User Story Point, Actual Cost then add them up either by iteration or total to calculate Planned Value and Budget.
Planned Value (PV) = Budget at Completion (BAC) x Story Points Planned
Earned Value (EV) = Budget at Completion (BAC) x Story Points Completed
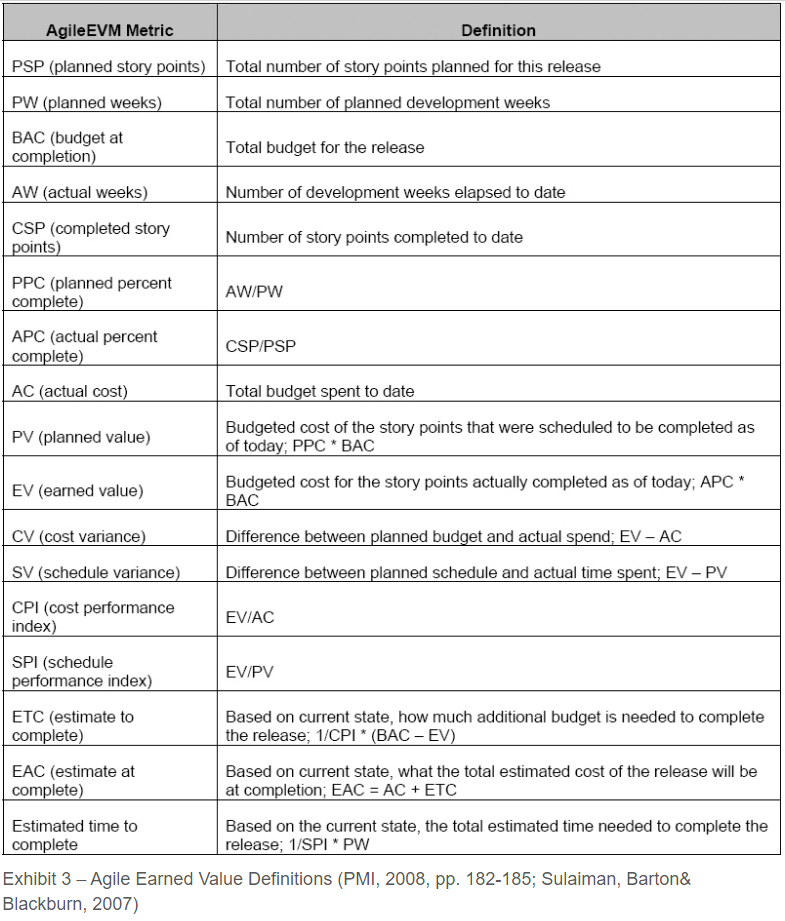
>> Test your knowledge in EVM by taking our 200 question PMP practice exam
Earned Value Management Graphs
The Earned Value Management graph is a Double S-Curve graph which has story points to the left, dollar value to the left and dates on the x-axis. This enables us to track scope and cost on the same graph. The PMI-ACP usually doesn’t include many figures or graphs but you might be asked to interpret an EVM or S-curve graph. You will not be asked to do any calculations.
- Once CPI is calculated if it is over 1 it is under budget, under 1 it is over budget and equal to 1 is on the budget.
- Once SPI is calculated if it is over 1 it is ahead of schedule, under 1 it is behind schedule and equal to 1 is on schedule.
*For remembering this I just think “High is Good, Low is Bad”
>> Great example of EVM by the PM Journal with EVM Graph
Trend Analysis
A product owner prioritizes the work and verifies its working as expected so while the software team is working the product owner is primary focused on customer satisfaction. To help with this they can use a data points such trend analysis.
Trend analysis collects data and analyzes them to detect patterns that may predict the future trajectory of the data. It is a very important tool for detecting problems as it provides insights into issue’s before they occur. Trend metrics are leading metrics as they provide an insight into what is happening now or in the future. Lagging metrics are metrics such as budget consumed which are based on the past.
